You are here
New Indicators of Resilience added to the Safe Cities Index 2019. Tokyo, Singapore and Osaka ranked top 3.
New Indicators of Resilience added to the Safe Cities Index 2019. Tokyo, Singapore and Osaka ranked top 3.
[中文翻譯版本即將推出。]
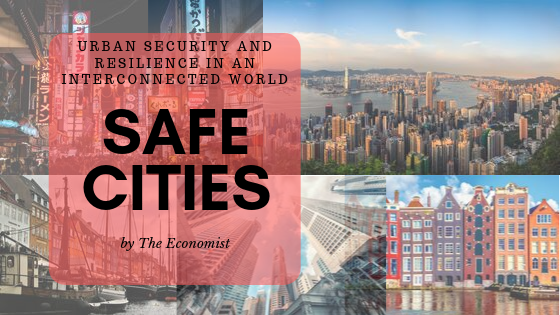
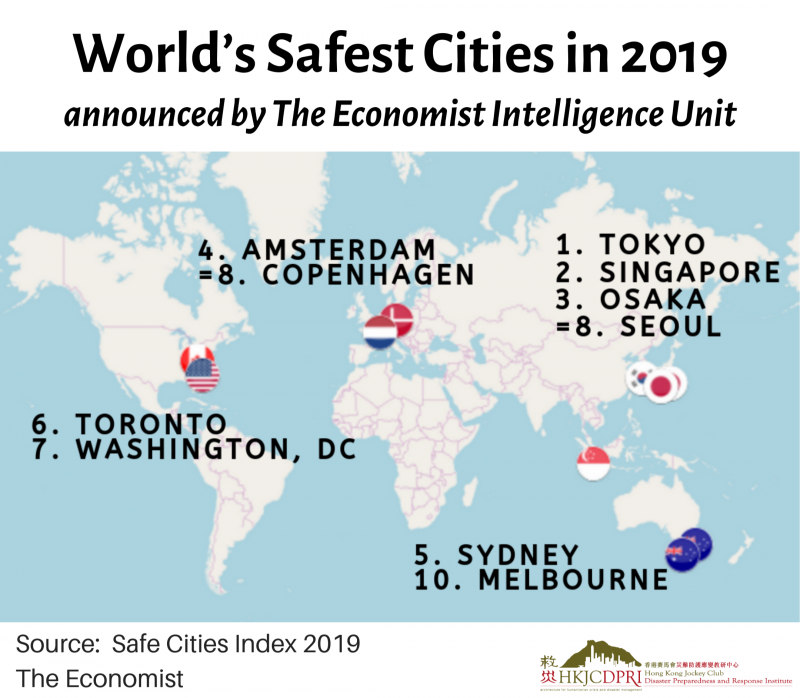
Tokyo, Singapore and Osaka ranked top 3 on the World’s Safe Cities list 2019 released by the Economist Intelligence Unit. The 2019 Safe Cities Index ranks 60 cities across 57 indicators covering digital security, health security, infrastructure security and personal security. It is the third time Tokyo was on the top since the biennial ranking started in 2015.
The Findings:
Hong Kong was down from 9th (2017) to 20th this year though this was not related to the ongoing protests in the city as the data used for the analysis was collected before the start of the protests. Six cities in the Asia Pacific were on the top 10, they were Tokyo, Singapore, Osaka, Sydney, Seoul and Melbourne. The two European cities made up the top 10 were Amsterdam and Copenhagen. Toronto and Washington DC were the North American cities on top 10.
Among the four categories of indicators, the only one that Hong Kong made the top (ranked three) was personal security. For the other three categories, Hong Kong was 27th in health security, 22nd digital security and 18th in infrastructure security. While Hong Kong ranked top in the personal security category, the report said that corruption and organised crime “are still a problem” for Hong Kong and Tokyo.
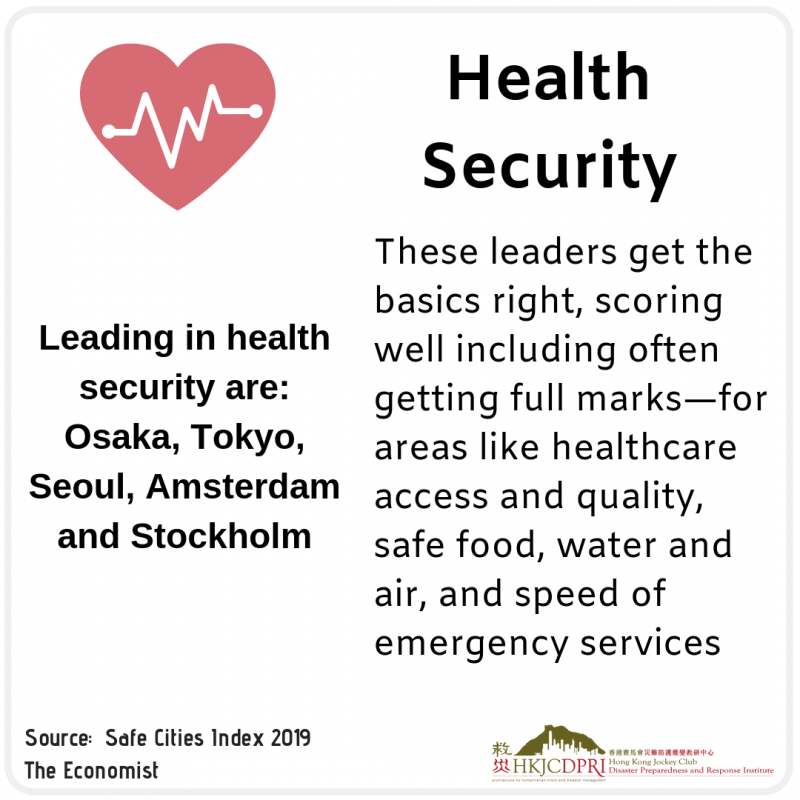
Hong Kong got the lowest ranking in health security among the four categories. Let’s look at what are in common in the top five countries in this category:
Safety is Multifaceted in Nature
The Safe Cities Index used a wide range of indicators to reflect the multifaceted nature of urban safety. In the introduction part of the full report, a good example cited by one of the interviewees, Mr Alioune Badiane, president of The Urban Think Tank Africa (TUTTA), Senegal, to explain the multifaceted nature was shared:
“......“in any city where you can often see a woman walking alone at night, you can bet that is a safe city.” On one level, this statement seems a simple one about personal security, in particular a low likelihood of violent attack. Looking deeper, though, quickly brings up more issues. Walking alone at night also requires infrastructure, including places to walk where one is unlikely to be hit by vehicles and lighting that not only deters violence but also lets our pedestrian see where she is going. Similarly, unhealthy levels of air pollution or a lack of public health education, which mean fewer people see the value of walking, could take our notional pedestrian off the street……”
New Indicators of Resilience Added in the 2019 Safe Cities Index
Previous reports of Safe Cities Index included indicators relevant to the danger of natural and man-made shocks. The 2019 index has put more advanced thinking on resilience by bolstering the number of indicators that deal with different aspects of it. The 2019 index measured for the first time things like the existence and speed of city emergency services; the existence of a disaster plan; the institutional capacity of those tasked with disaster response; the availability of disaster insurance; the ability to defend infrastructure against cyber-attacks; and the extent of hazard monitoring.
The 57 indicators in the four categories:
|
Digital Security |
|
|
Infrastructure Security |
|
|
Health Security |
|
|
Personal Security |
|
The Safe Cities Index 2019 is a biennial report from the Economist Intelligence Unit. In its third edition, the index assessed the relevant strengths and weaknesses of leading cities worldwide and the findings were supplemented with wide-ranging research and in-depth interviews with experts in the field including one from Hong Kong, Mr Victor Lam, Hong Kong’s government chief information officer.
For full report, please visit: https://safecities.economist.com/safe-cities-index-2019/
By Hong Kong Jockey Club Disaster Preparedness and Response Institute
#blog


